
FIGURE 6.
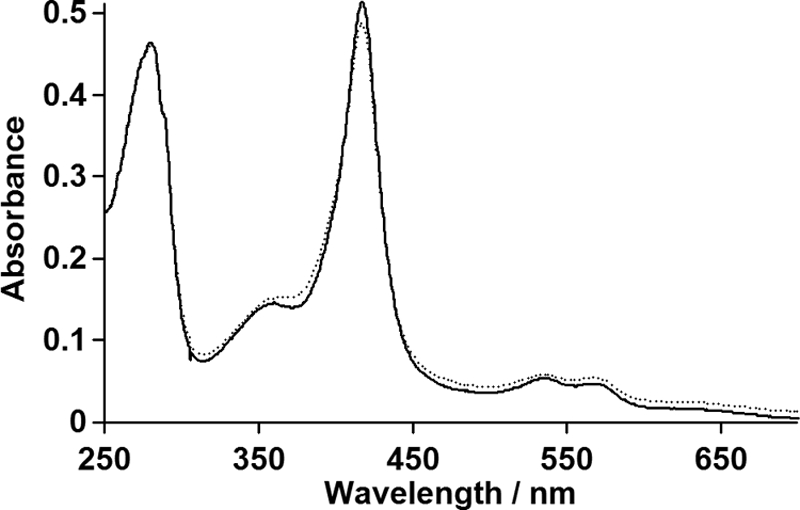
UV-visible absorption spectra of P450SPα. The spectra of P450SPα in 0.1 m potassium phosphate buffer (pH 7.0) containing 0.3 m KCl and 20% (v/v) glycerol in the absence (solid line) and presence of 120 μm of myristic acid (dotted line). The concentration of P450SPα was 3.1 μm.