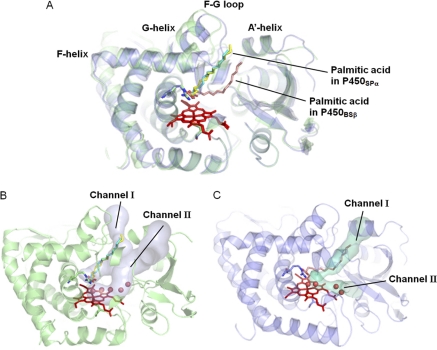
FIGURE 8.
Overall structure of P450SPα superposed on that of P450BSβ. A, the superposition of the structures. The structures of P450SPα and P450BSβ are represented in green and blue, respectively. Heme is depicted as a red stick model. Palmitic acids in P450SPα and P450BSβ are represented as a yellow and cyan stick models and a pink stick model, respectively. B and C, substrate access channel location of P450SPα (B) and P450BSβ (C) calculated using CAVER (51) are shown as a light blue surface for P450SPα and a cyan surface for P450BSβ.

