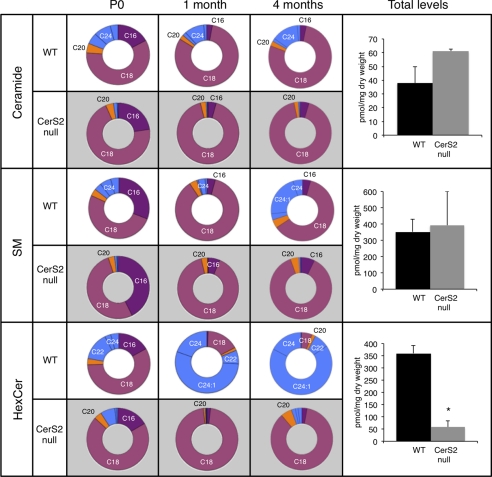
FIGURE 1.
LC-ESI MS/MS analysis of acyl chain distribution and total SL levels in CerS2-null mouse brain. The pie charts show the acyl chain distribution at P0, 1 month, and 4 months of age as a percentage of the total. The right-hand column shows total SL levels in 4-month-old brains. Supplemental Table 1 gives HexCer levels in pmol/mg of tissue. Data are from two mice for which triplicate analyses were performed ± S.D., *, p < 0.01.

