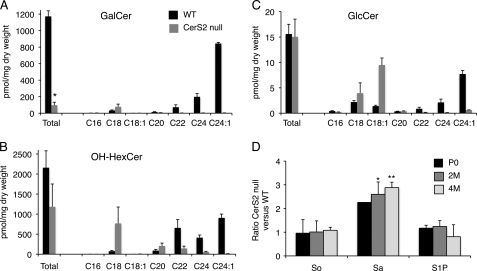
FIGURE 2.
Total HexCer and long chain base levels in 4-month-old mice. Total GalCer (A), OH-HexCer (B), and GlcCer (C) levels and acyl chain distribution are shown. The left-hand columns show total HexCer levels, and the other columns show levels of individual acyl chains. Values are means ± S.D. for which duplicate analyses were performed (n = 2). *, p < 0.01. D, -fold change in CerS2-null versus WT mice for the long chain bases sphingosine (So), sphinganine (Sa), and sphingosine 1-phosphate (S1P) at different ages: newborn (P0), 2 months (2M) of age, and 4 months (4M) of age. Values are means ± S.D. (n = 2). *, p < 0.05; **, p < 0.01.

