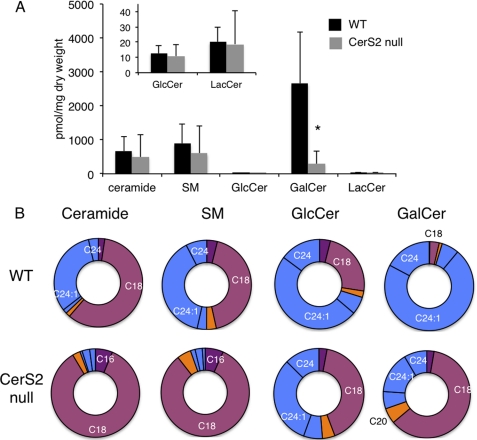
FIGURE 3.
LC-ESI MS/MS analysis of SL composition of myelin. A, total SL levels in purified myelin. The inset shows levels of GlcCer and lactosylceramide (LacCer). *, p < 0.05. B, acyl chain distribution of myelin. Supplemental Table 2 gives SL levels in pmol/mg of tissue. Values are means ± S.D. (n = 3) in which two analyses were performed on 3-month-old mice and one analysis was performed on 5-month old mice with no significant differences between them.

