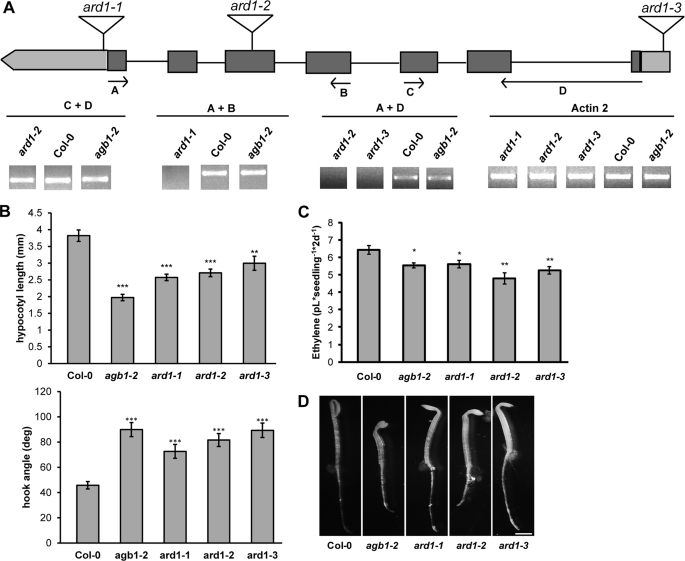
FIGURE 2.
ARD1 and AGB1 share etiolated hypocotyl phenotypes. A, location of three tDNA insertions in ARD1. Arrows indicate genotyping primers used to amplify the mRNA transcript. RT-PCR was performed using the primers indicated. Actin2 was used as a reference transcript. PCR products were run on two separate gels in nonadjacent lanes. B, hypocotyl lengths and apical hook angles of 2-day-old etiolated seedlings. *, p < 0.05; **, p < 0.005; ***, p < 0.0005. Results were an average of two independent experiments and are representative of three additional experiments performed. Error bars, means ± S.E. C, ethylene biosynthesis of wild type and ard1 or agb1 mutant plants grown in the dark for 2 days. Each measurement is an average of at least three vials, and the experiments were repeated with similar results. *, p < 0.05; **, p < 0.005. Error bars, means ± S.E. D, etiolated phenotype of 2-day-old seedlings. Bar, 1 mm.

