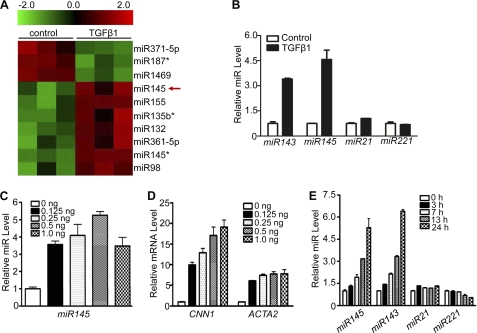
FIGURE 2.
TGF-β1-induced miR143/145 expression in HCASM. A, heat map illustrating relative expression of a sample of miRs in triplicate control or TGF-β1 (1 ng/ml)-treated HCASM. B, qPCR validation of indicated miRs in HCASM treated with 1 ng/ml TGF-β1 for 24 h. The expression level of each miR reflects the -fold change relative to vehicle control (set to 1). C and D, qPCR analysis of miR145 (C) and two SMC contractile genes (D) in HCASM following 24-h treatment with varying concentrations of TGF-β1. E, HCASM were treated with TGF-β1 (1 ng/ml) for the indicated times, and qPCR was performed to measure normalized expression of miR143/145, miR21, and miR221. Relative miR expression is the -fold change relative to control (time 0) set to 1. All data shown are representative of at least three independent experiments. Error bars, S.D.

