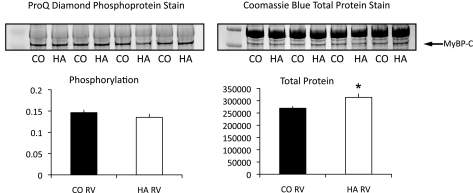
Fig. 2.
MyBP-C expression and phosphorylation. 7.5% SDS-PAGE was used to increase the separation of myosin and MyBP-C to more accurately quantify changes in MyBP-C expression and phosphorylation. Phosphorylated MyBP-C was quantified by dividing the PQD signal by the Coomassie brilliant blue (CBB) signal for MyBP-C. Total MyBP-C was quantified by densitometry of the CBB signal. Total protein (50 μg) was loaded in each lane. n = 5. *P < 0.005, control vs. failure.

