Fig. 4.
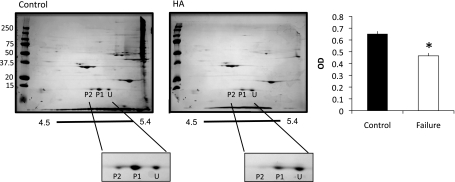
Absolute quantitation of MLC2 phosphorylation. Two-dimensional SDS-PAGE was used to quantify changes in MLC2 phosphorylation in control and HA animals. Spots corresponding to MLC have been enlarged for clarity. Phosphorylation was calculated as P1 + P2/U + P1 + P2. n = 5 control and 5 HA. *P < 0.05.

