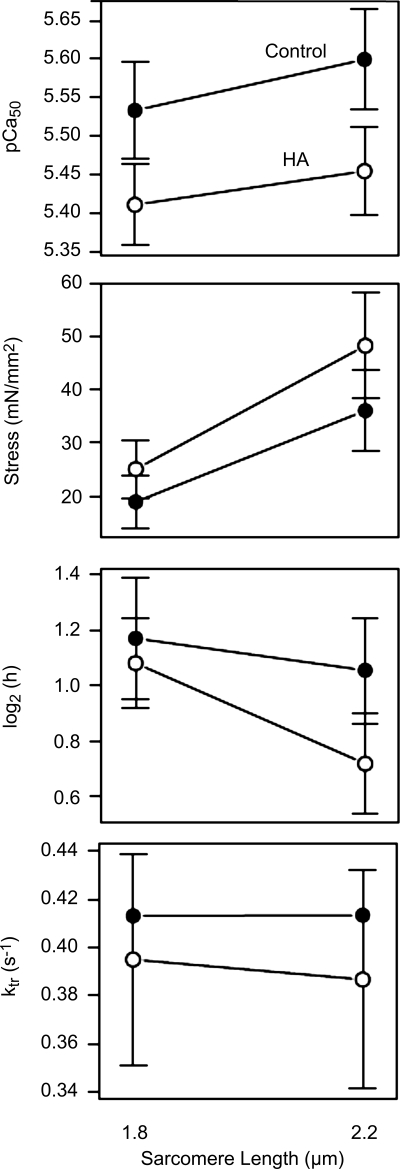
Fig. 7.
Mechanical characterization of control and HA RVs. The dependence of parameters of the Hill equation on HA and sarcomere length is shown. Error bars denote 95% confidence intervals. Nonoverlap indicates significant differences at P < 0.05. Top: significant reduction in pCa50 in HA compared with control (P = 0.03). There was a significant increase in Ca2+ sensitivity with an increase in sarcomere length (P < 0.01) but no significant interaction of HA with sarcomere length (P = 0.37). Middle top: significant increase in developed tension with increase in sarcomere length (P < 0.01) but no significant effect of HA (P = 0.30) or interaction between sarcomere length and HA (P = 0.10). Middle bottom: log2 of the Hill coefficient, a normally distributed measure of cooperativity (46) in muscle, which showed a significant decline in cooperativity with increases in sarcomere length (P = 0.002) but no significant change in the HA group compared with the control group (P = 0.14) and no significant interaction (P = 0.10). Bottom: cross-bridge turnover rates (ktr), which showed no significant differences with treatment.

