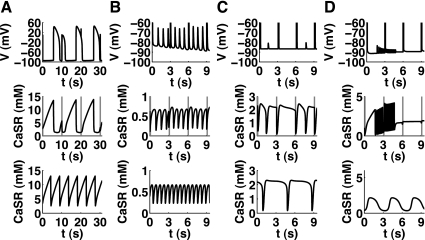
Fig. 4.
Correlation between the appearance of DADs and oscillations in reduced models during Na+ overload. The top and middle top rows show the output of the full models, whereas the bottom row shows Ca2+ content of the SR in the reduced models. The initial value for intracellular Na+ was set to 80 mM for the Fink08 model (A), 15 mM for the Maleckar08 (B) and Matsuoka03 (C) models, and 35 mM for Pasek08 model (D), while the BCL was changed from 1 to 3 s (10 s for the Fink08 model). Due to the high level of intracellular Na+ necessary in the Fink08 model to produce oscillations, the Ca2+ cycling in the full model was almost independent of the AP stimulus (gray vertical lines).

