Figure 5.
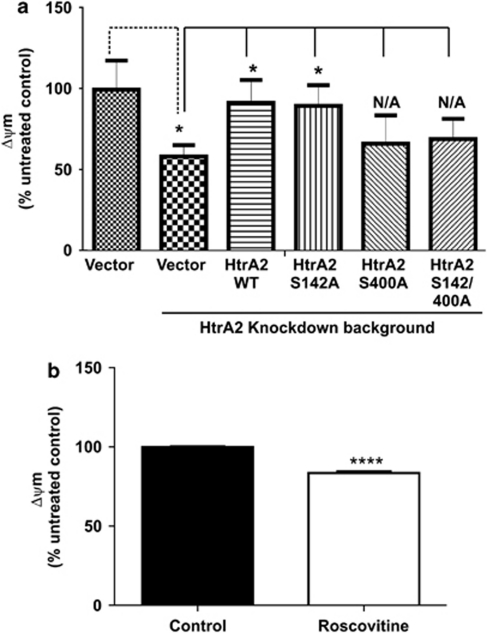
Relevance of HtrA2 phosphorylation by Cdk5. (a) Mitochondrial membrane potential (Δψm) determined by TMRM fluorescence in live ΔMEKK3-ER cells with an HtrA2 KD background, overexpressing WT HtrA2 or HtrA2 phosphomutants, stimulated or not with 4OH-Tx for 8 h. Mean maximum TMRM fluorescence was determined for approximately 80 individual mitochondria in a field of view for each condition, for each independent experiment (n=3), from Z-stack images using the Andor IQ analysis software. The data are expressed as mean maximum TMRM fluorescence in 4OH-Tx-stimulated cells as a percentage of that in untreated controls. Statistical analyses: Two-way ANOVA where treatment is significant (P≤0.01) and HtrA2 expression is significant (P<0.001), and one-way ANOVA where HtrA2 is insignificant in untreated cells but significant (P<0.001) in 4OH-Tx-treated cells, where n=3. Student's t-test compared the effect of the treatment in untransfected cells and 4OH-Tx-treated, untransfected cells to that in 4OH-Tx-treated cells transfected with HtrA2 and HtrA2 phosphomutants (shown on graph), where *P≤0.05 (n=3). (b) Δψm is determined by TMRM fluorescence in live Hek293T cells treated or not with 20 μM Roscovitine for 8 h. Mean maximum TMRM fluorescence was determined for approximately 80 individual mitochondria in a field of view for each condition, for each independent experiment (n=3), from Z-stack images using the Andor IQ analysis software. Statistical analyses: Student's t-test compared the effect of the Roscovitine treatment with the control where ****P≤0.0001

