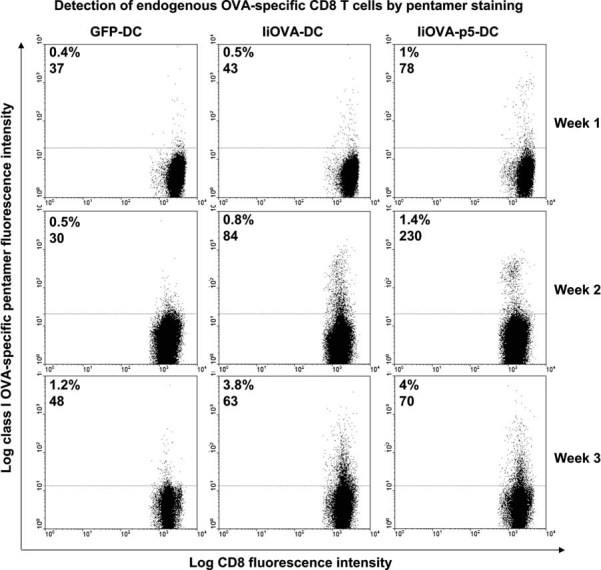
Figure 5. PD-L1 silencing in DCs accelerates expansion of endogenous antigen-specific CD8+ T cells.

As in Fig 4G, flow cytometry analyses of endogenous OVA-specific CD8+ T cells expanded after vaccination with the indicated transduced DCs (top of the graphs). T cells from draining inguinal lymph nodes were stained with a class I-specific OVA pentamer, and percentages of pentamer-specific OT-I cells, with their corresponding mean fluorescent intensities are shown in each graph. Analyses were performed 1 week after vaccination (top row, indicated on the right of the graphs), 2 weeks (middle row) and 3 weeks (bottom row). Vaccination groups consisted of between 3 and 5 mice. Plots correspond to individual mice.
