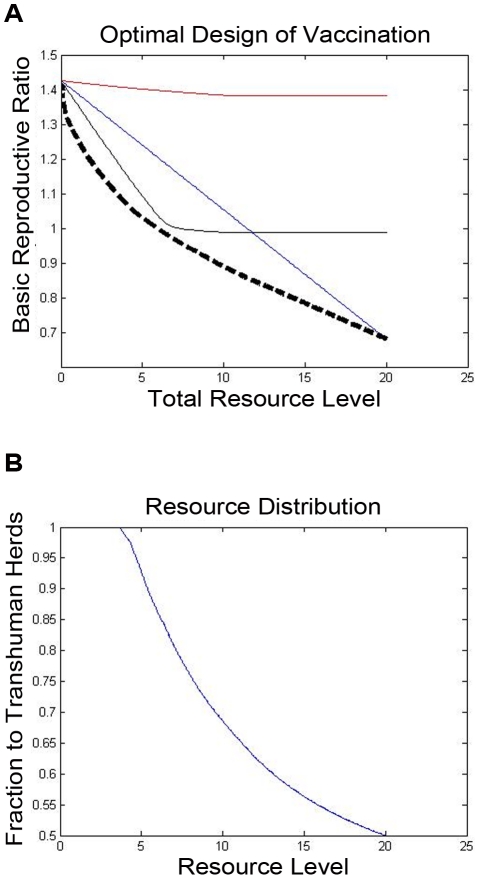
Figure 6. Designing an optimal vaccination policy.
In the upper plot, The basic reproductive number when the optimal vaccination policy is used is shown, for the twenty-herd example. Here, the three light, solid lines indicate the performance of the only-transhumance, only-sedentary, and uniform vaccination policies as developed in Figure 4. The performance of the optimal resource allocation is highlighted as a bold, dashed line. Also, the fraction of resources allocated to the sedentary herds at the optimum is shown.

