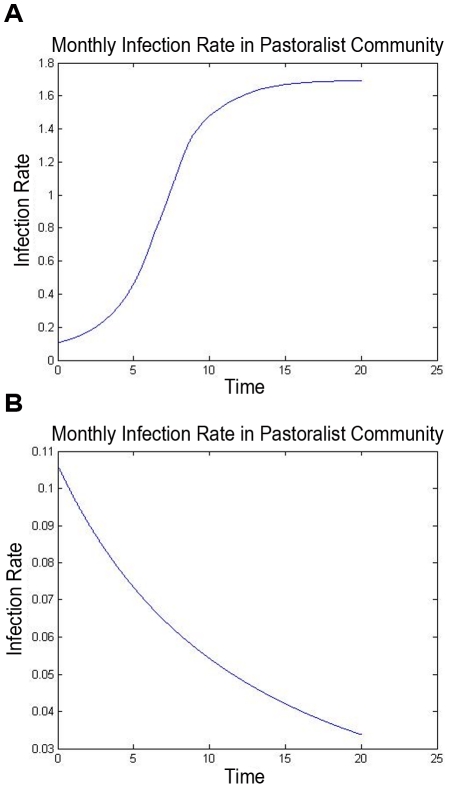
Figure 7. Human infection rate determined by the spread model.
The rate of infection in the human pastoralist subpopulation in a brucellosis outbreak with an initial low level of infection in the cattle population is shown. The upper figure shows the case where no control is used, and the lower shows the case where an optimal animal-vaccination policy is applied. It is worth noting that the nonlinear model for spread was used to simulate the infection rate, since the linear model quickly becomes inaccurate in the no-control case.

