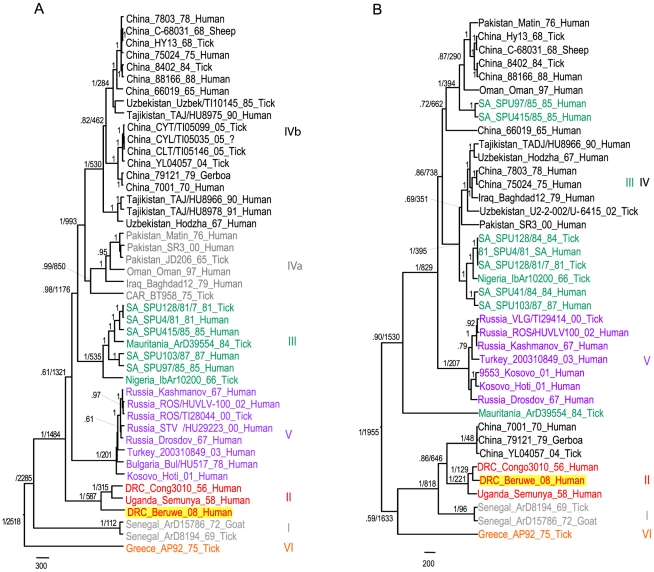
Figure 2. Phylogenetic analysis of CCHFV in segments S and M.
Caption A: analysis performed on 1501 nucleotides of segment S (near complete sequence). Caption B: analysis performed on partial segment M sequence, 1001 nucleotides long. Genotypes are indicated in roman numerals, named according to Caroll et al. [2] with the equivalent group nomenclature according to Chamberlin et al. [4] indicated in brackets: I – West Africa (Africa 1); II – Central Africa (Africa 2); III – South and West Africa (Africa 3); IV – Middle East/Asia, divided into groups IVa and IVb respectively corresponding to groups Asia 1 and Asia 2 acoording to [4]; V – Europe/Turkey (Europe 1); VI- Greece (Europe 2). The sequence from this study is highlighted in gold. Sequences are named as follows: country_strain_sampling year_host. Posterior probabilities are indicated above branches, followed by node age estimations. For clarity, posterior probability values below 0.6 and date estimates for the terminal branches were removed. The scale bar corresponds to evolutionary distance in years.

