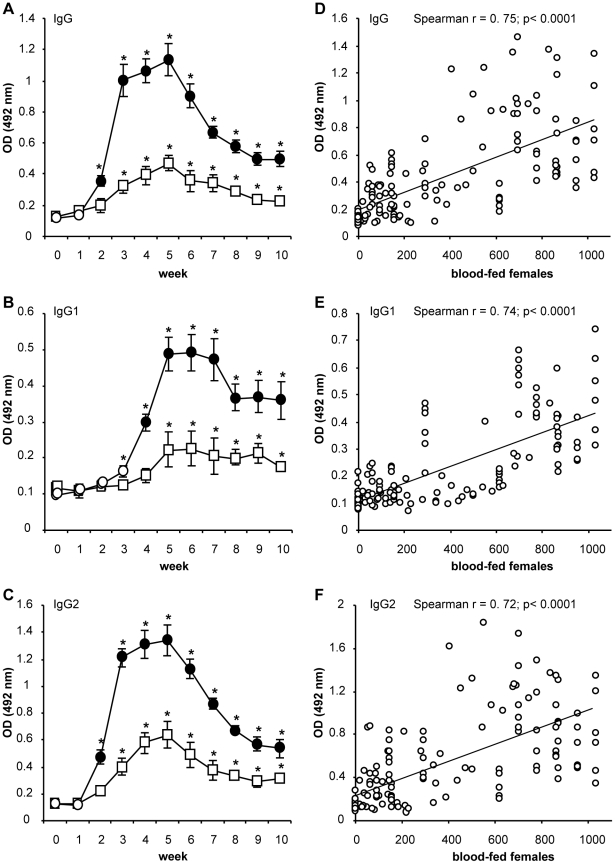
Figure 1. Anti-sand fly saliva antibody response in dogs experimentally bitten by Phlebotomus perniciosus.
(A–C) Beagle dogs (3 per group) were divided into low-exposed (square) and high-exposed groups (circles) and were exposed to sand fly bites in weeks 1–5. For detailed numbers of blood-fed females see Table 1. Levels of specific IgG (A); IgG1 (B); and IgG2 (C) were measured by ELISA (at 492 nm) in all canine pre-immune and immune sera. Full circles represent significant difference between high- and low-exposed dogs (p<0.05); asterisks indicate significant difference (p<0.05) compared to pre-immune sera. Data are presented as the means ± standard errors of the means from two independent studies. (D–F) Correlation between number of blood-fed sand fly females and the levels of canine anti-P. perniciosus IgG (D); IgG1 (E); and IgG2 (F) was performed using Spearman Rank Correlation Matrix. OD = optical density.

