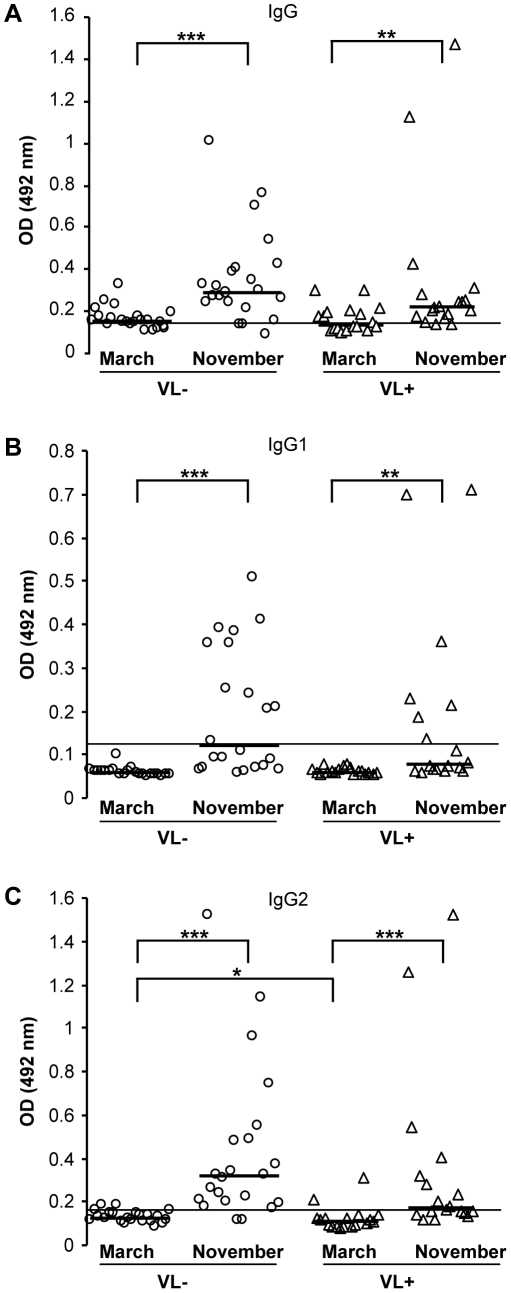
Figure 2. Anti-sand fly saliva antibody response in dogs naturally bitten by Phlebotomus perniciosus.
Anti-P. perniciosus IgG (A); IgG1 (B) and IgG2 (C) response was measured in sera of naturally bitten dogs from endemic area of visceral leishmaniasis. All dogs were Leishmania infantum seronegative at the beginning of the trial. ELISA was performed against P. perniciosus salivary gland homogenate using canine sera from Leishmania infantum-seropositive dogs (open triangle, n = 18) and Leishmania-seronegative dogs (open circles, n = 22). Serum samples were taken at the beginning (March) and at the end of the sand fly season (November). The symbols indicate results of each serum tested, bars represent median values of the groups. Lines represent cut-off values (two times the standard error of the mean of the absorbance of experimentally bitten dog pre-immune sera). Asterisks indicate statistical significance between Leishmania-seropositive and -seronegative dogs and significant increase of antibodies during the sand fly season within the group (* p<0.05; ** p<0.01; *** p<0.001). OD = optical density.

