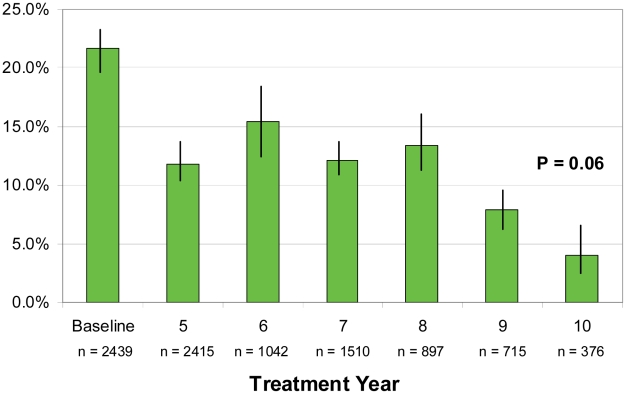
Figure 5. Mean sentinel village antigen prevalence by MDA treatment year (n = 9,394).
Filarial antigenemia as determined by ICT testing. SV results across all four MDA phases have been adjusted to MDA treatment year for comparability. Data for the baseline antigen for five villages (Gbuwhen, Gwamlar, Lankan, Maiganga, and Seri) were from 1999–2000 mapping surveys. Baseline for the remaining villages (Akwete, Anzara, Babale, Dokan Tofa, Piapung) combined values from the community wide nocturnal pre-treatment surveys conducted in 2003 with pre-treatment data from the 1999–2000 mapping surveys. Chi square for trend not significant (p = 0.06 for all MDA years and p = 0.271 for baseline through MDA year 6). Bars show 95% confidence intervals.

