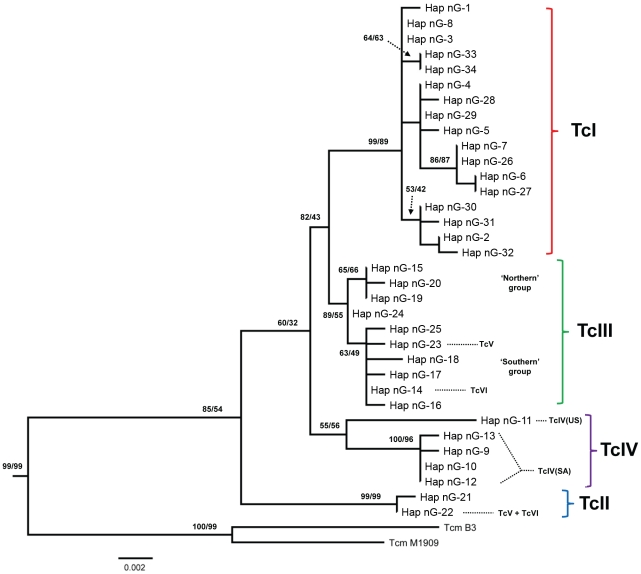
Figure 1. Maximum likelihood tree of GPI sequences (unique haplotypes).
Four major clades are indicated according to corresponding T. cruzi lineage; TcV and TcVI haplotypes are within the parental TcII and TcIII clades from which they are derived. Where clear geographic associations were evident these are indicated: US (samples from USA); SA (samples from South America); ‘Northern’ and ‘Southern’ groups within TcIII are as defined previously [36]. Branches separating T. cruzi from T. rangeli and T. brucei (outgroup) are not shown. Bootstrap support values for branches (if >50%) are shown and were calculated for the equivalent nodes of the bootstrap consensus NJ/MP trees (1000 replicates). Scale units are substitutions/site.

