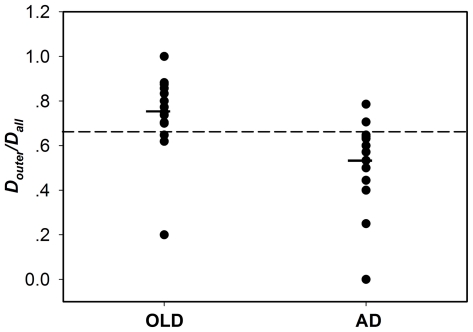
Figure 3. Individual scores for Douter/Dall.
The group means were significantly different in: (Douter/Dall)old>(Douter/Dall)AD (one-way ANOVA test, p<0.05) .The horizontal line indicates a cutoff point of 0.647 by ROC analysis where13 of 16 elderly subjects and 13 of 15 AD patients are correctly categorized.

