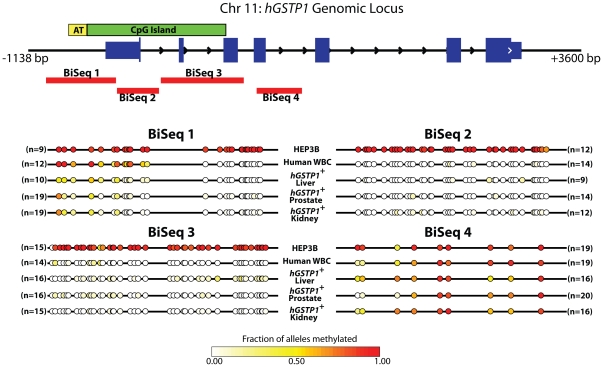
Figure 3. The hGSTP1 transgene in hGSTP1+mGstp1/2−/− mice recapitulates the pattern of methylation seen in normal human cells.
Bisulfite genomic sequencing for 5-meC in four amplicons (labeled BiSeq 1–4)from the hGSTP1 CpG island using DNA from various hGSTP1+mGstp1/2−/− mouse tissues (hGSTP1+ liver, prostate, kidney), along with DNA from human white blood cells (normal hGSTP1 5-meC pattern) and Hep3B cells (hypermethylated at hGSTP1 CpG island). Each row represents a summary of multiple independently cloned alleles from each sample as indicated. Circles indicate the relative position of CpG dinucleotides within the bisulfite sequencing amplicon. The color of each circle is scaled to the fraction of alleles methylated for the indicated CpG according to the heatmap shown at the bottom.

