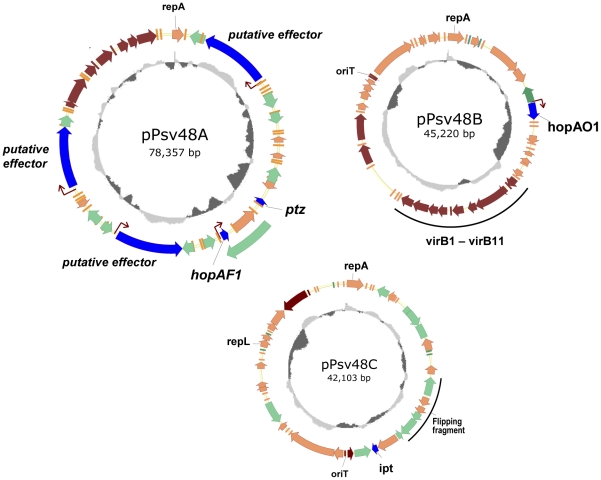
Figure 2. Genetic maps of plasmids pPsv48A, pPsv48B and pPsv48C.
Genes are color-coded according to category or putative function as follows: genes putatively involved in host-interaction and virulence are shown in blue; putative mobile elements are indicated in green, and homologs of Type IV secretion systems genes are shown in brown; the remaining genes are shown in orange. The effector transposon ISPsy30 is shown as a green arrow out of the map of pPsv48A. Prototypical hrp boxes are indicated by brown arrows. The inner circles indicate the GC content (window, 1000; step, 5), with values above and below the average shown in light and dark grey, respectively. Plasmids are drawn to scale.

