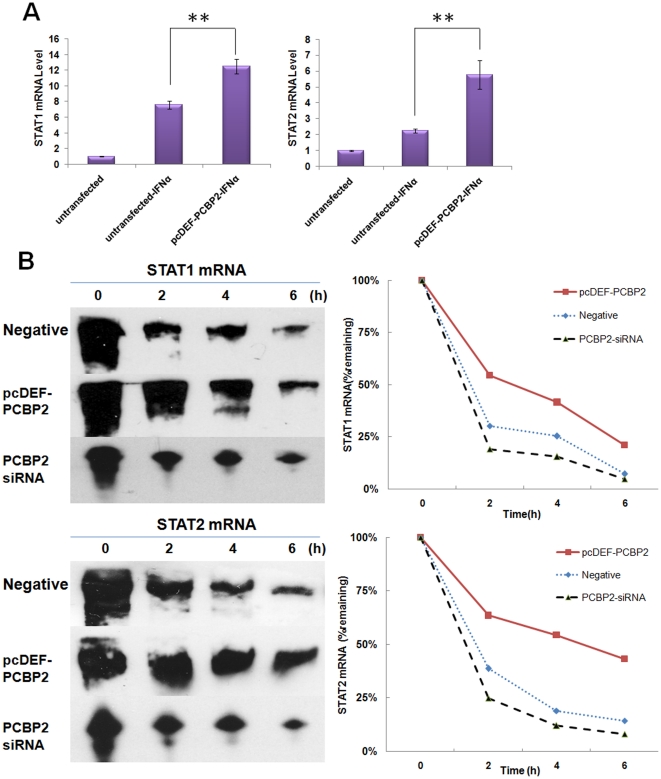
Figure 6. The STAT1 and STAT2 mRNA is stabilized in cells overexpressing PCBP2.
(A) qRT-PCR was carried out to measure mRNA level of STAT1 and STAT2 after 6 hours of IFN-α treatment. R1b cells were untransfected or transfected with pcDEF-PCBP2. Each bar represents the average of triplicate data points with the standard deviation represented as the error bar. **P<0.001 versus untransfection. (B) RPA and RNA half-life analysis was performed to monitor the STAT1 and STAT2 mRNA decay course. Two days after transfection, IFN-α was added and 6 hours later actinomycin D was added to inhibit transcription. Representative blots are shown in the left panel and the mRNA levels were quantified through densitometric scanning. For each set of RPAs, the band intensity at the 0 h time point was set to 100%, and the percentage of mRNA of remaining at the 2, 4 and 6 hour time point was plotted shown in the right panel.

