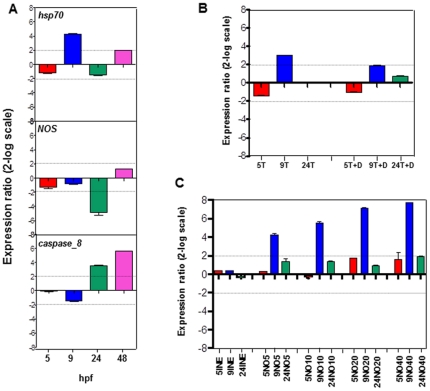
Figure 5. Gene expression levels using Real Time qPCR.
(A) hsp70, NOS and caspase-8 gene expression levels were followed by Real Time qPCR. Samples incubated with DD were collected at 5, 9, 24 and 48 hpf. (B) hsp70 in samples incubated with DD in the absence and presence of TRIM. 5T, 9T, 24T: samples treated with TRIM and collected at 5, 9 and 24 hpf, respectively. 5T+D, 9T+D, 24T+D: samples treated with TRIM and DD and collected at different times. (C) hsp70 in samples incubated with increasing concentrations of sper/NO. Spermine was used as a control. 5INE, 9INE, 24INE: samples treated with spermine at different times; 5NO5, 9NO5, 24NO5: samples treated with sper/NO 5 µM; 5NO10, 9NO10, 24NO10: samples treated with sper/NO 10 µM; 5NO20, 9NO20, 24NO20: samples treated with sper/NO 20 µM; 5NO40, 9NO40, 24NO40: samples treated with sper/NO 40 µM. Data in histograms are expressed as a fold difference from control and are reported as mean ± S.D. Fold differences greater than ±2 (see dotted horizontal guidelines at values of 2 and −2 on the histograms) were considered significant.

