
Figure 1. Microarray analysis of differentially expressed miRNAs in the perinatal rat pancreas.
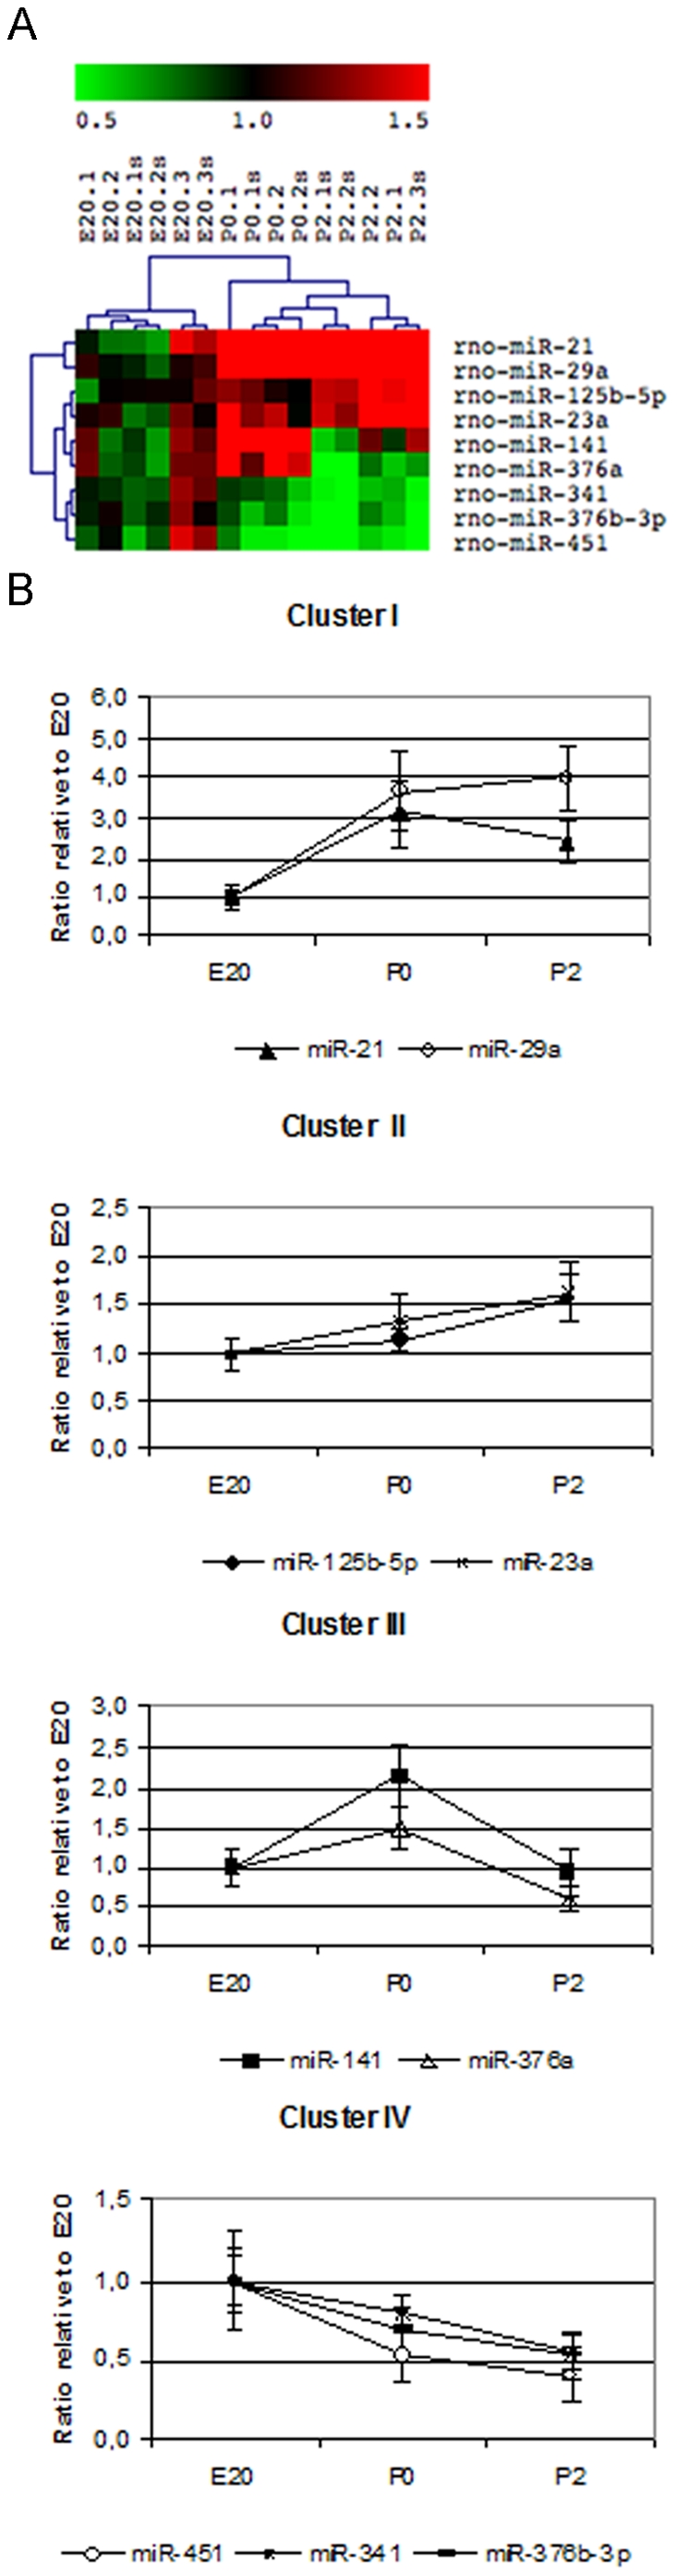
A. Heat-map showing hierarchical gene-tree and sample clusters of the 9 miRNAs that were significantly (p<0.01) regulated more than 1.5-fold. Sample to reference ratio for the different biological samples are shown. (Complete heat-map is shown in Fig.S1). B. Expression pattern of the miRNAs based on the gene-tree clustering. Shown is the ratio compared to E20 of the mean of sample to reference ratio with SD.