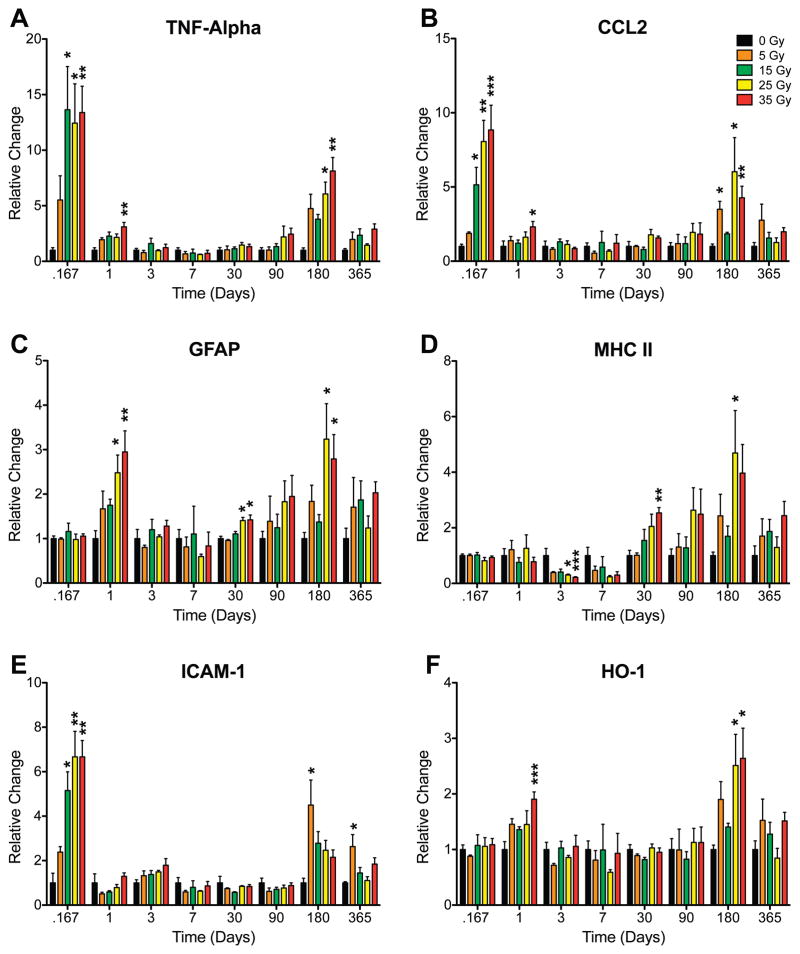
FIG. 2.
Relative changes in selected neuroinflammatory mRNA level as a function of radiation dose and time after irradiation. Panel A: TNFA; panel B: CCL2; panel C: GFAP; panel D: MHC II; panel E: ICAM-1; panel F: HO-1. Kruskal-Wallis tests were run at each time for each gene followed by Dunn’s multiple comparison tests comparing each dose to its respective control. Each bar represents the mean for 3 to 5 mice in each condition; error bars are SEM. *P < 0.05, ** P < 0.01, ***P < 0.001.

