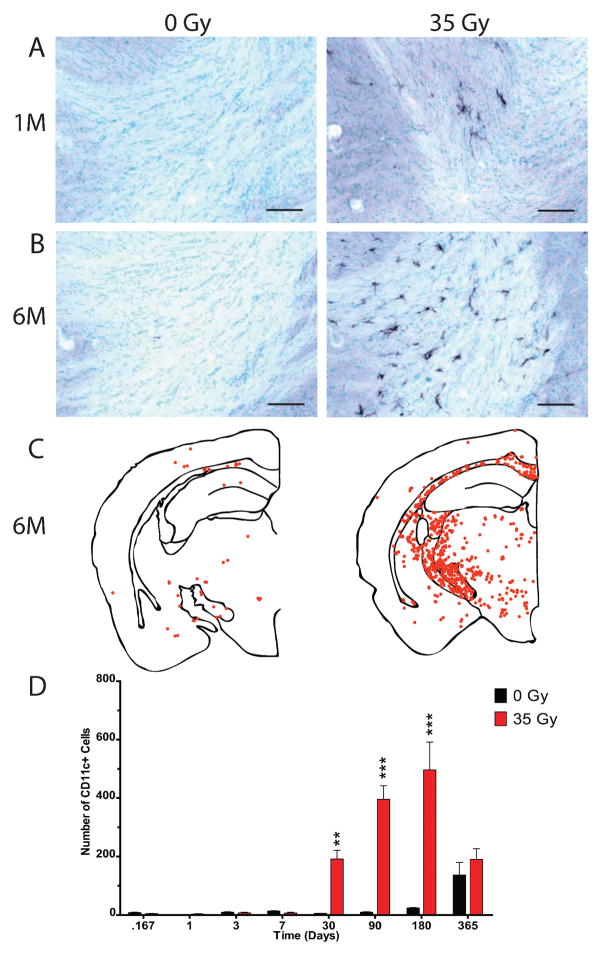
FIG. 7.
Delayed increase in CD11c expressing cells after cranial irradiation. Sections from 0- and 35-Gy irradiated animals were stained for CD11c antigen and methyl green (Vector). Representative photomicrographs are shown at 1 month (panel A) and 6 months (panel B) postirradiation. Scale bars in panels A and B: 100 μm. Representative dot plots demonstrating the distribution of CD11c-positive cells for 0- and 35-Gy animals at 6 months (panel C). Each point represents one CD11c-positive cell. The total number of cells from the first two sections containing both blades of the dentate gyrus was quantified in 0- and 35-Gy irradiated animals, starting at 4 h (panel D). Two-way ANOVA and Bonferroni post-tests compared 0- and 35-Gy animals for each time. Graph shows means ± SEM, n = 5–6 per condition for each time: *P ≤ 0.05, **P ≤ 0.01, and ***P ≤ 0.001.

