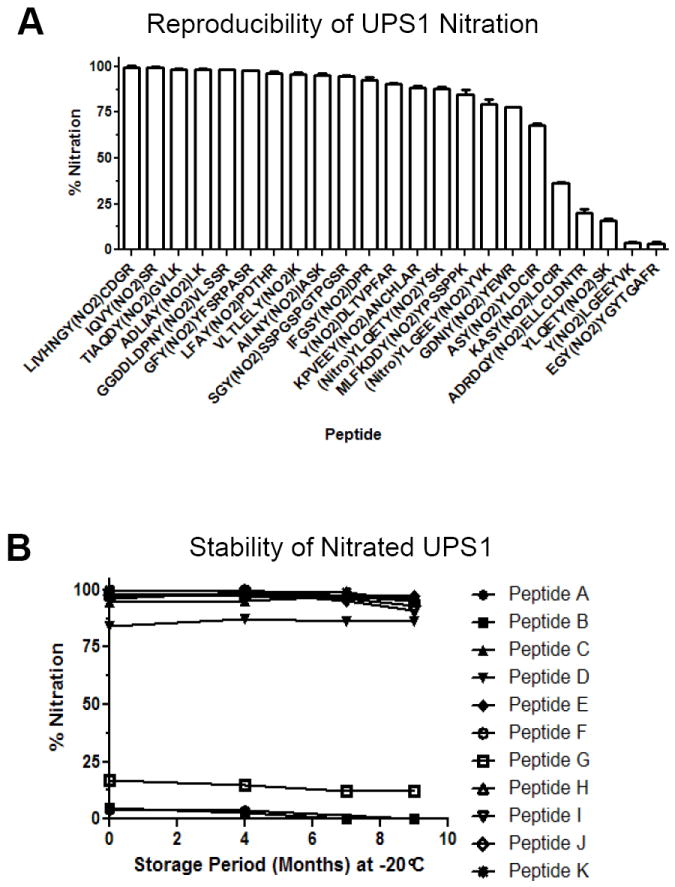
Figure 6. UPS1 nitration is reproducible and stable.

A) Two independent nitration reactions were performed on UPS1 and the levels of nitration was evaluated by quantitative MRM. The y-axis represents ion percentage of 3NT peptide relative to the unmodified peptide with representative peptides shown. Error bars represent the standard of deviation. B) Storage stability evaluation of 3NT modified UPS1 peptides by quantitative MRM assay of a set of ions on 4000 QTRAP MS platform. The y-axis represents the peak area percentage of the 3NT peptide divided by the total peak area of the unmodified and 3NT species of the peptide. The x-axis displays storage period in month at -20°C.
