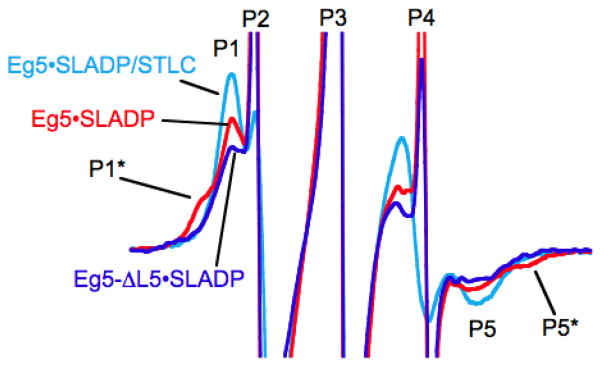
Figure 1.
X-band EPR spectra of 2′,3′-SLADP bound to Eg5 (red), Eg5-ΔL5 (blue) and Eg5 in the presence of the inhibitor, STLC (cyan). The horizontal axis is magnetic field. The vertical axis is the derivative of absorbance. The spectra are 9.0 mT wide with center field at 350 mT. The figure is similar a previously published figure [1] and is present to motivate the computational modeling.

