
Figure 5.

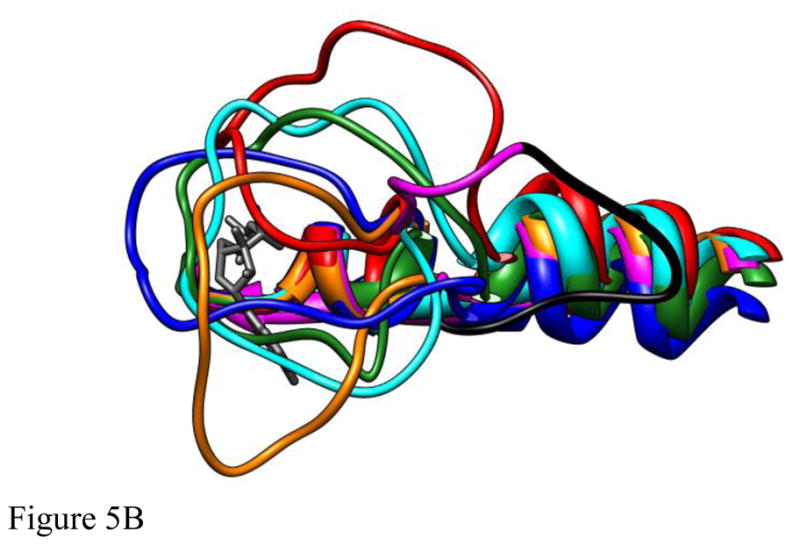
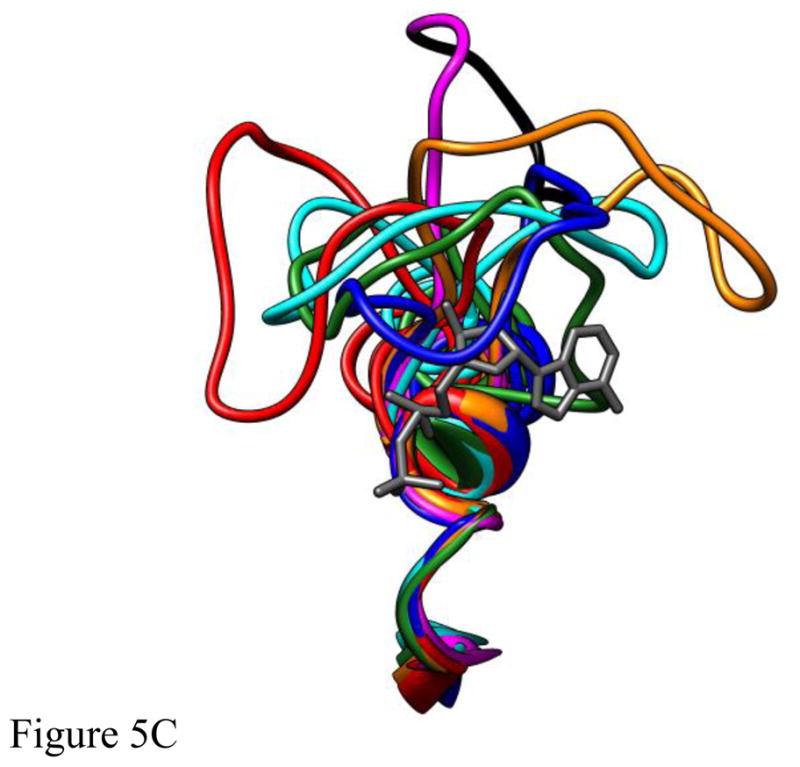
The structures of five different deformations of L5 in the Eg5•ADP structure (blue, cyan, red, green, orange) interacting with ADP bound at the nucleotide site (dark gray) following 4ns of MD simulation. The structures were superimposed using a least-squares distance minimization of the P-loop Cα atoms. The structure of Eg5•ADP (magenta with the domain deleted for Eg5-ΔL5 in black) is shown for comparison. Fig. 5A is oriented from the side with L5 at the top of the panel. Fig. 5B looks down from the top of panel A. Fig. 5C looks from a direction facing the bound ADP.