
Figure 3.
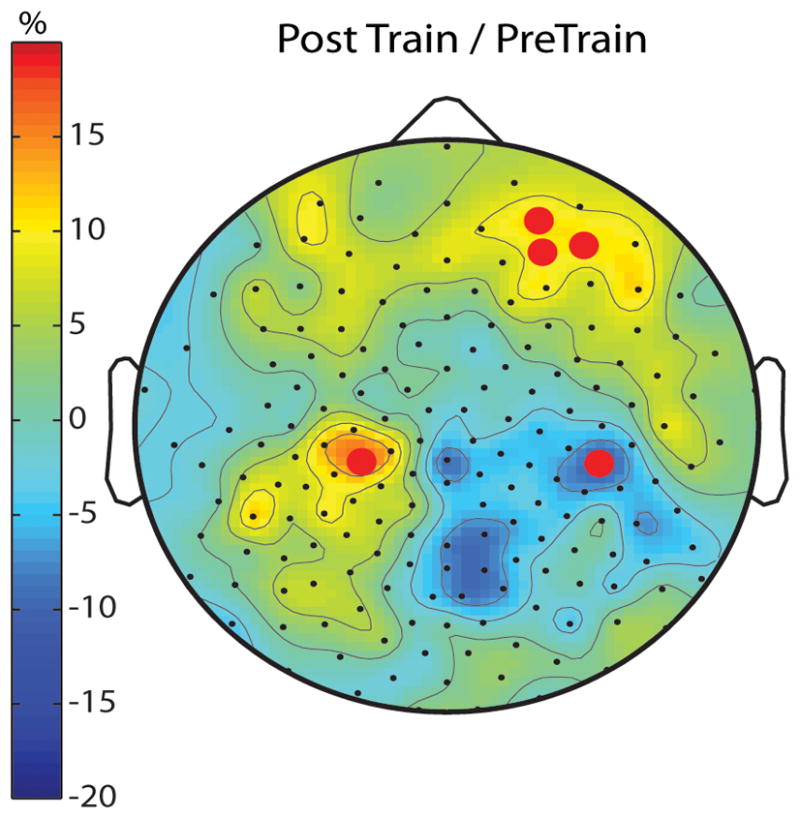
Waking EEG trace of learning. Topographic distribution of spontaneous, waking, eyes-open, IAF power after visuomotor rotation learning for the combined CAS and SWD expressed as percentage difference relative to before training. Red dots mark channels showing significant pre- to post-training differences (uncorrected for multiple comparisons, paired t-test N=15).