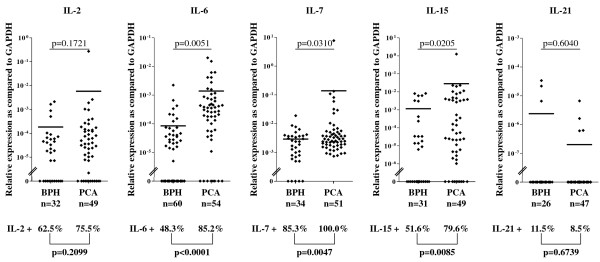
Figure 1.
Expression of IL genes in early stage PCA and BPH tissues. Total cellular RNA was extracted from BPH and PCA tissues, DNAse treated, reverse transcribed and analyzed by quantitative real-time PCR for IL-2 (BPH: n = 32, PCA: n = 49), IL-7 (BPH: n = 34, PCA: n = 51), IL-15 (BPH: n = 31, PCA: n = 49), IL-6 (BPH: n = 60, PCA: n = 54) and IL-21 (BPH: n = 26, PCA: n = 47) specific gene expression. Data are expressed as ratio to GAPDH gene expression. Mean values (▬) are indicated for each group. Digits in individual panels indicate percentages of samples displaying gene expression levels exceeding detection limits (bold, bottom of the panel) and statistical significance of differential extent of specific gene expression in BPH or PCA specimens (top of the panel).

