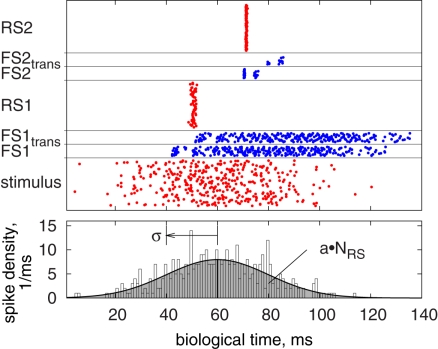
Figure 11.
A sample pulse pattern of the synfire chain, with pulses of the inhibitory FS populations transmitted via the PCS. Upper plot: pulses sorted by population, from the bottom: initial stimulus, resultant activity of the first inhibitory FS population before (FS1) and after (FS1trans) transmission, activity of the first excitatory RS population (RS1), and the corresponding patterns for the second group of populations (compare Figure 8). Lower plot: given spike density and resulting histogram of the stimulus in the upper plot. Parameters are a = 4, σ = 20 ms, FS-to-RS (hardware) delay 10 ms.

