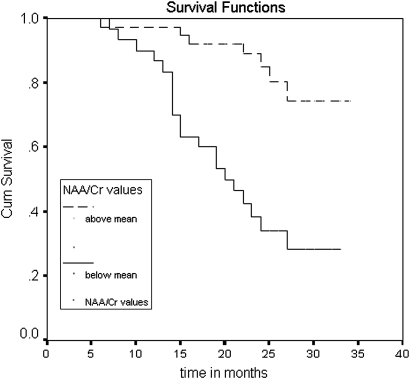
Figure 3.
Comparison of survival curves for the variable N-acetyl-aspartate/Cr in the posteromedial parietal cortex. The curves represent the proportion of patients not converting to dementia across the time according to the NAA/Cr ratios. Upper curve: patients with ratios equal to or above mean. Lower curve: patients with ratios below mean.

