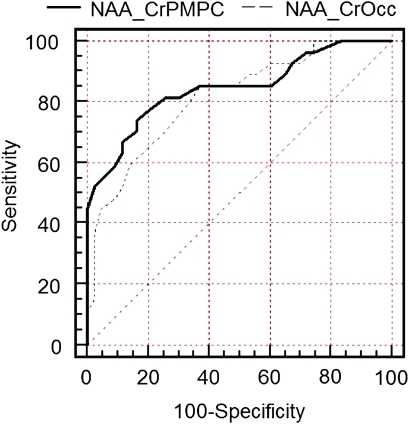
Figure 5.
Comparison of the receiver operating characteristic curves for the N-acetyl-aspartate/Cr ratio in the posteromedial parietal cortex (continuous line) and the N-acetyl-aspartate/Cr ratio in the left occipital lobe (discontinuous line). Each curve represents the estimations of prediction of conversion to dementia for each of either variables. All predictive values are given in the text.

