Fig. 4.

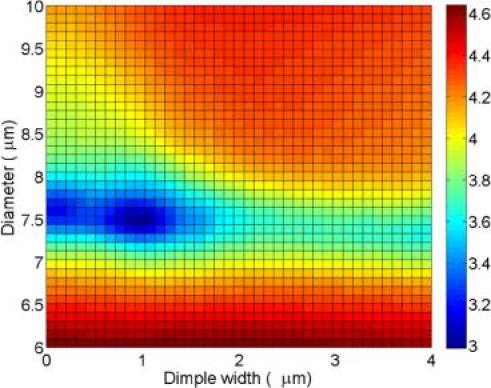
Least square error plot (log scale). The lowest point indicates the best fit. The color bar indicates the relative error value (a. u.).

Least square error plot (log scale). The lowest point indicates the best fit. The color bar indicates the relative error value (a. u.).