Fig. 5.

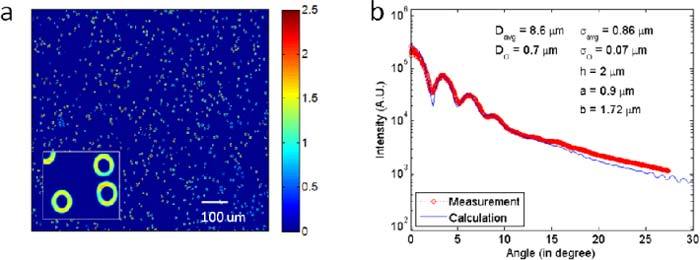
(a) Quantitative phase image of an RBC smear. (b) Comparison of the angular scattering from the simulation with that of the measurement.

(a) Quantitative phase image of an RBC smear. (b) Comparison of the angular scattering from the simulation with that of the measurement.