
Fig. 3.
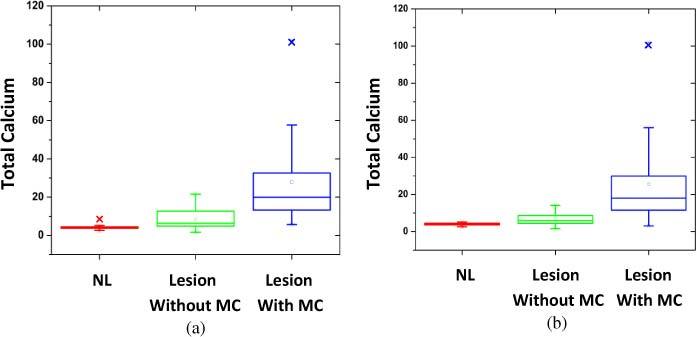
Box plots of the distribution of FC for total calcium for breast tissue sites classified by (a) radiographic appearance alone and (b) radiography plus histopathology (MC, microcalcifications).
Official websites use .gov
A
.gov website belongs to an official
government organization in the United States.
Secure .gov websites use HTTPS
A lock (
) or https:// means you've safely
connected to the .gov website. Share sensitive
information only on official, secure websites.
Box plots of the distribution of FC for total calcium for breast tissue sites classified by (a) radiographic appearance alone and (b) radiography plus histopathology (MC, microcalcifications).