Fig. 5.

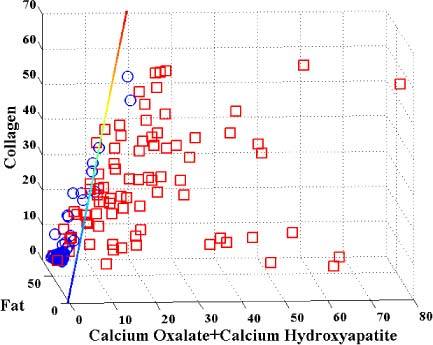
Logistic regression Raman algorithm distinguishing lesions with microcalcifications (red squares) from normals + lesions without microcalcifications (blue circles), classified by radiography plus histopathology.

Logistic regression Raman algorithm distinguishing lesions with microcalcifications (red squares) from normals + lesions without microcalcifications (blue circles), classified by radiography plus histopathology.