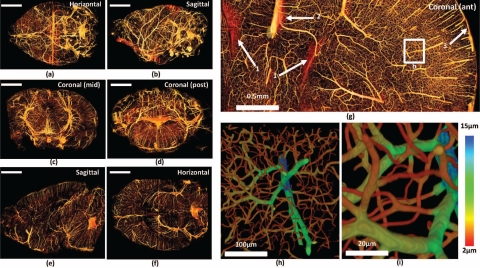
Fig. 3.
Visualization of the whole-brain vascular data set. The whole downsampled brain is shown (a–b) along with cross-sections composed of ≈ 200 slices (c–f). Scale bars = 2mm. (g) Close-up of an anterior coronal section through the cortex. Features labeled are (1) surface of the lateral ventricles, (2) Pericallosal artery, and (3) the cortical surface with descending microvessels. (h–i) Close-up of a volume reconstruction of the labeled region. Color value indicates estimated vessel radius computed by performing a distance transform on the medial axis.

