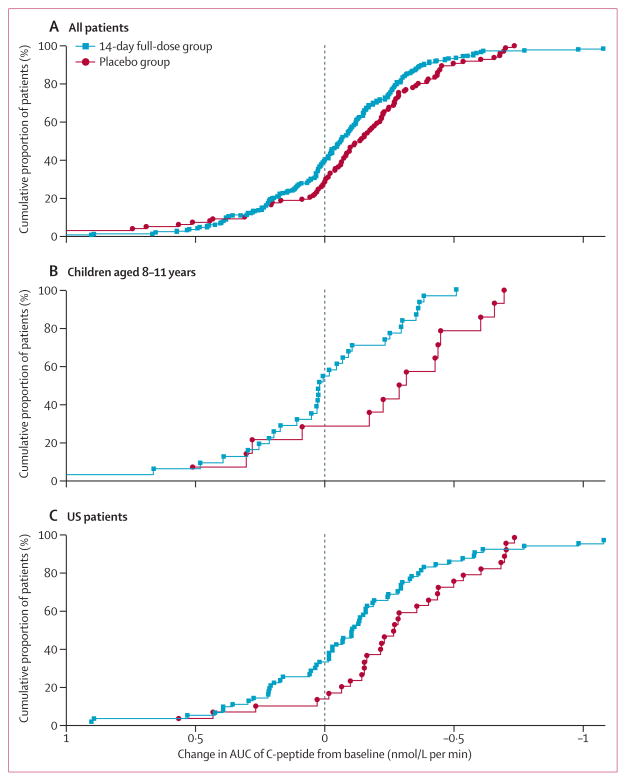
Figure 3. Cumulative distribution of change in AUC of C-peptide from baseline at 1 year.
(A) All patients (n=298). (B) Children aged 8–11 years. (C) US patients. Because of violations of normality assumptions, inferential comparisons were made with non-parametric methods (Wilcoxon rank-sum test). AUC=area under the curve.

