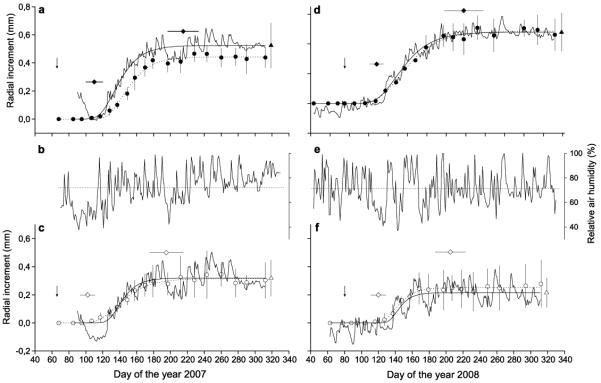
Fig. 5.
Comparison between mean radial increment determined by dendrometers (n = 3 trees/site) and measurement of the developing xylem (including enlarging, wall thickening and mature xylem cells; n = 5 trees/site) in 2007 (a, c) and 2008 (d, f). Mean standard deviation between dendrometer records are indicated by triangles. Study sites are denoted by closed and open circles for the dry-mesic and xeric site, respectively. Daily variation in relative air humidity in 2007 and 2008 are depicted in (b) and (e), respectively, and horizontal dotted lines indicate mean values. Radial increment curves were modelled by applying the Gompertz function for each site and year (for parameters see Table 3), whereby thin and dotted lines are models fitted for radius change and cell growth, respectively. SD for tree-ring width determined by XCD are indicated (n = 5 trees/site). Diamonds indicate day of the year ± SD, when one horizontal row of cells in the enlarging phase was detected at the start and end of the growing season. Arrows point to time of bud break.

