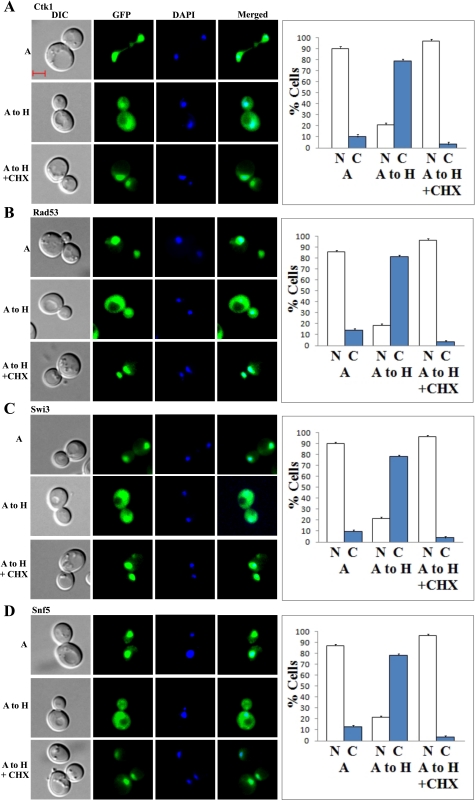
Fig. 10.
A–D: examples of images of cells expressing redistributed nuclear proteins when shifted from normoxic to hypoxic growth conditions. Cells expressing GFP-tagged Ctk1 (A), Rad53 (B), Swi3 (C), and Snf5 (D), respectively, were grown under normoxic conditions and then shifted to hypoxic conditions for 6 h in the presence or absence of cycloheximide. A, images of cells grown in air; A to H, images of cells grown in air and then shifted to a hypoxia chamber for 6 h; A to H + CHX, images of cells grown in air and then shifted to a hypoxia chamber for 6 h in the presence of cycloheximide. The number of cells showing GFP-tagged proteins in the nucleus (N) or cytosol (C) was counted and the percentage was calculated and is plotted here. The scale bar represents 2 μm.

