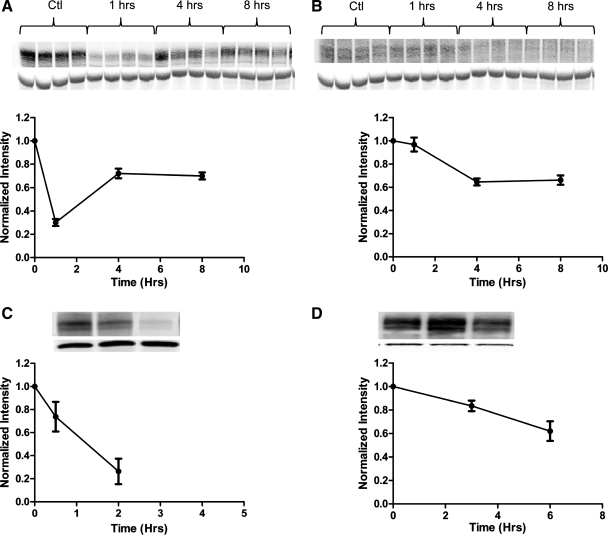
Fig. 2.
Parathyroid hormone (PTH) has a differential effect on the time course of removal of NaPi2a and NaPi2c from the BBM. A: Western blot analysis of the brush border abundance of NaPi2a after treatment with PTH. Mice were injected with 20 μg PTH 1-34/100 g body wt or vehicle at time (t) = 0, and kidneys were harvested at the time points indicated. Eight animals per time point were used. Western blots are shown of 4 representative animals, and staining for actin is shown below the corresponding band of interest. To compare intensities across time points, after normalization to β-actin, all band intensities were normalized to t = 0. Ctl, control. Data are shown as means ± SE. B: Western blot analysis of the BBM abundance of NaPi2c after treatment with PTH. C: Western blot analysis of the brush border abundance of NaPi4 (the OK homolog to NaPi2a) in opossum kidney proximal tubule cells (OKP). Cells were treated with PTH at t = 0, and BBM were prepared at the time points indicated. All experiments were performed in triplicate. D: Western blot analysis of the brush border abundance of NaPi2c in OKP cells after treatment with PTH. OKP cells were transfected with enhanced yellow fluorescent protein (eYFP)-tagged NaPi2c and treated with PTH 48 h after transfection. Cells were harvested at the time points indicated. To account for slight differences in transfection efficiencies between dishes, the brush border abundance of eYFP-NaPi2c in each dish was normalized to the abundance of eYFP-NaPi2c in the cellular homogenate (see Supplemental Fig. S1; Supplemental Material for this article is available online at the Journal website). All experiments were performed in triplicate.

