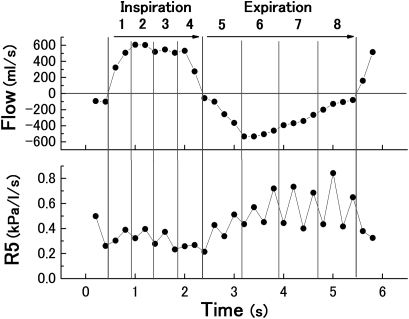
Figure 1.
Traces drawn based on digital data obtained every 0.2 s from the impulse oscillometry measurement. The respiratory cycle was separated into inspiration and expiration according to spontaneous airflow data (upper panel), and quartile time fractions 1 to 4 and 5 to 8 were labelled. The lower panel is an example of impulse oscillometry data assigned to eight fractions of Rrs at 5 Hz (R5).

