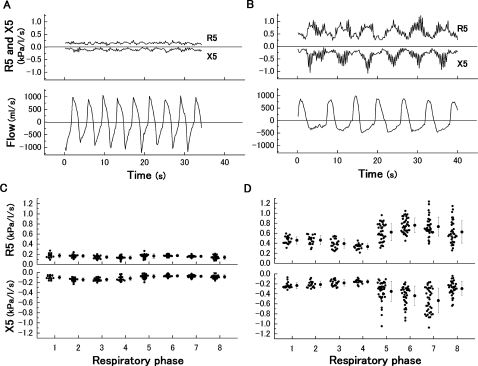
Figure 2.
Typical time courses of R5 and X5 in (A) a healthy subject (male, 64 years, percentage forced expiratory volume in 1 s=102.9%) and (B) a patient with severe chronic obstructive pulmonary disease (male, 70 years, percentage forced expiratory volume in 1 s=22.7%) shown with spontaneous airflow. Averaged data among each fraction in the same case are shown in (C) (healthy) and (D) (chronic obstructive pulmonary disease). Data are expressed as raw data and mean±SD.

