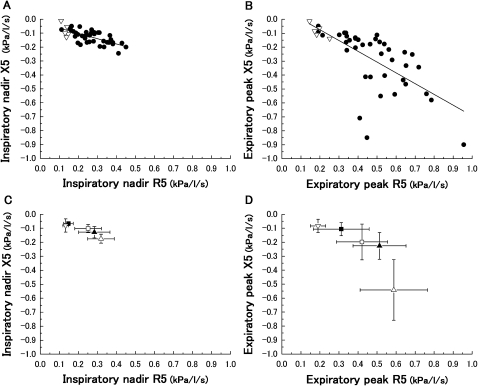
Figure 6.
Relationships between during inspiratory nadir values of R5 and X5 (A) and expiratory peak values of R5 and X5 (B) (▿, healthy; ●, chronic obstructive pulmonary disease). Significant correlations were obtained ((A), r=−0.70; p<0.0001; (B), r=−0.67; p<0.0001). Both relationships are also shown according to chronic obstructive pulmonary disease severity (■, Stage I; □, Stage II; ▲, Stage III; ▵, Stage IV) and healthy subjects (▿). Data are expressed as mean±SD.

