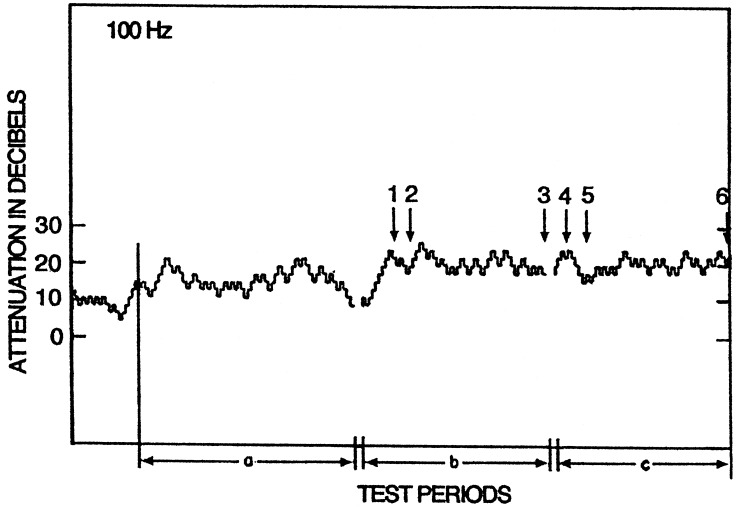
Figure 1.
Attenuator tracing of the detection threshold of one observer for a 100-Hz tone in one experimental session consisting of three test periods of ≈7-min each separated by 5-min rest periods. The vertical steps are 2 dB in size. The arrows indicate four periods over which the numbers of steps were counted. Note that attenuation steps are the inverse of intensity steps. (Modified from ref. 4).

