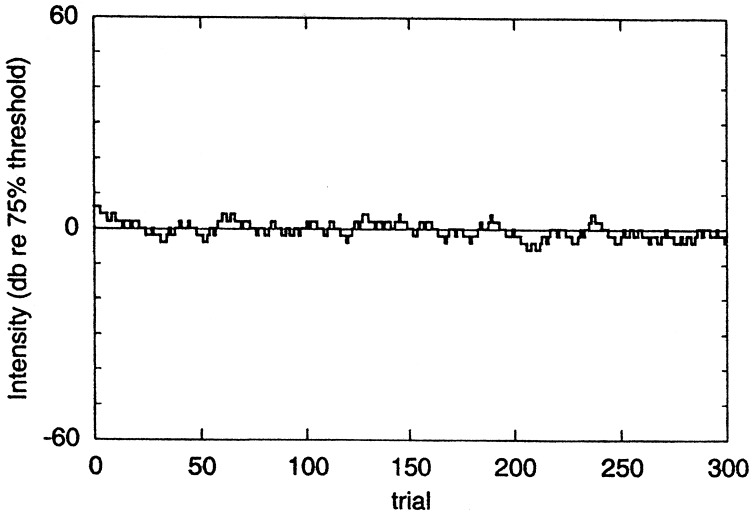
Figure 2.
Graphic representation of an example of the computer simulation of the procedure with a starting level 5 dB above the target eqilibration level and a 2-dB step size. The axes of the figure are similar to those of Fig. 1, but the tracing differs somewhat in that the level is plotted for every trial rather than only when the level is changed.

